Seasonality Playbook: Political Direct Response
Two years of quarterly benchmarks for CPD, ROAS, and CPL across Meta, Google, X, and YouTube — broken down by platform, quarter, and election cycle.
What Two Years of Political Ad Data Taught Us About Seasonality
The political direct response campaigns that outperform their competitors aren't simply spending more. They're spending at the right time — and most campaigns have no idea what that means.
We do. After two years of tracking direct response performance across PACs, campaigns, C4s, and advocacy organizations — covering donor CPD, ROAS, and lead acquisition costs on Meta, Google, X, and YouTube — the seasonality pattern is unmistakable. And almost nobody is using it.
When should you scale your political direct response budget? What quarter produces the cheapest donors? When does lead gen ROAS peak — and when does it collapse? Is off-cycle spending actually worth it?
This playbook answers all of it with two years of real performance data, broken down by quarter, by platform, and by cycle year. If you're planning 2026 campaign spend, you'll want to read the whole thing.
Overview
This analysis covers direct response advertising performance across PACs, campaigns, C4s, and advocacy organizations from Q2 2023 through Q2 2025. We tracked donor CPD and ROAS alongside lead CPA across Meta, Google, X, and YouTube.
Metrics Defined
- CPA (Cost per Acquisition): The cost to acquire a new lead or action
- CPD (Cost per Donor): The cost to acquire a new donor — specifically, cost per dollar raised
- ROAS (Return on Ad Spend): Revenue generated per dollar spent on advertising
Key Takeaway: There is clear seasonality between election and off-cycle years. Election years drive more efficient donor conversion. CPDs and ROAS improve when urgency is high — the best time to scale is Q1 and Q2 of on-years. Off-cycle periods see higher costs and softer value; use them for testing and engagement, not high-volume acquisition.
Direct Response Seasonality at a Glance (Indexed % of Average)
| Quarter | Year | CPD | ROAS | CPL |
|---|---|---|---|---|
| Q1 | 2023 | 1845% | 1% | 53% |
| Q2 | 2023 | 155% | 133% | 70% |
| Q3 | 2023 | 98% | 139% | 111% |
| Q4 | 2023 | 118% | 87% | 82% |
| Q1 | 2024 | 96% | 129% | 143% |
| Q2 | 2024 | 70% | 112% | 84% |
| Q3 | 2024 | 67% | 77% | 112% |
| Q1 | 2025 | 131% | 75% | 109% |
| Q2 | 2025 | 146% | 51% | 209% |
Quarterly Donor Trends: Peaks and Valleys
Key Takeaway: Q1 is the weakest quarter for donor performance — use it for testing and warming audiences. Q2 is the strongest — the best quarter to scale donor acquisition. Q3 CPDs improve but ROAS declines — focus on building your donor file. Q4 urgency rebounds — lean in for conversion and retention.
Direct Donate ROAS by Platform (% of Baseline)
| Quarter | Meta | X | YouTube | Total ROAS | |
|---|---|---|---|---|---|
| Q1 | 70% | 111% | 50% | n/a | 67% |
| Q2 | 104% | 89% | 150% | 130% | 119% |
| Q3 | 115% | 141% | 89% | 10% | 99% |
| Q4 | 78% | 83% | 142% | n/a | 87% |
Cost Per New Donor (% of Baseline)
| Quarter | Meta CPD | Google CPD | X CPD | YouTube CPD | Total CPD |
|---|---|---|---|---|---|
| Q1 | 198% | 71% | 392% | n/a | 164% |
| Q2 | 119% | 128% | 87% | 83% | 127% |
| Q3 | 76% | 62% | 98% | 436% | 75% |
| Q4 | 135% | 109% | 51% | n/a | 119% |
Lead Gen Seasonality: Strongest in Q4
Key Takeaway: Q1–Q2 are prospecting periods — fill the pipeline and warm audiences. Q3 lead value improves — prioritize quality targeting. Q4 is the most efficient quarter for scale with the lowest CPLs and strong ROAS.
Lead Gen ROAS (% of Baseline)
| Quarter | Meta ROAS | Google ROAS | X ROAS | YouTube ROAS | Total ROAS |
|---|---|---|---|---|---|
| Q1 | n/a | 121% | 44% | n/a | 60% |
| Q2 | 100% | 32% | 112% | 53% | 60% |
| Q3 | 200% | 184% | 106% | 112% | 140% |
| Q4 | 100% | 116% | 100% | 6% | 130% |
Lead Gen CPA (% of Baseline)
| Quarter | Meta CPA | Google CPA | X CPA | YouTube CPA | Total CPA |
|---|---|---|---|---|---|
| Q1 | 93% | 155% | 126% | n/a | 94% |
| Q2 | 116% | 91% | 75% | 175% | 98% |
| Q3 | 96% | 104% | 130% | 93% | 111% |
| Q4 | 72% | 95% | 70% | 70% | 82% |
Donor Performance: Election Year vs. Off-Cycle
Key Takeaway: During election years, CPAs are significantly more efficient — Meta drops to 66% of baseline, X to 94%, and YouTube to just 28%. Donor value and ROAS are also stronger. During off-cycle years, CPAs increase sharply (Meta 158%, X 151%, YouTube 167%) and ROAS moderates. Use off-cycle periods to maintain engagement, nurture your file, and test creative — avoid over-scaling acquisition.
Direct Donate ROAS by Year (% of Baseline)
| Year Type | Meta ROAS | Google ROAS | X ROAS | YouTube ROAS | Total ROAS |
|---|---|---|---|---|---|
| Election Year | 137% | 94% | 108% | 320% | 88% |
| Off-Cycle | 85% | 88% | 95% | 70% | 90% |
Cost Per New Donor by Year (% of Baseline)
| Year Type | Meta CPD | Google CPD | X CPD | YouTube CPD | Total CPD |
|---|---|---|---|---|---|
| Election Year | 66% | 97% | 94% | 28% | 70% |
| Off-Cycle | 158% | 77% | 151% | 167% | 137% |
Lead Gen Performance: Election Year vs. Off-Cycle
Key Takeaway: During election years, CPAs run 25–30% below norms. Meta and Google delivered approximately 2x average ROAS (200–210%). Total ROAS hit 140%. Scale lead gen aggressively and move leads into the conversion pipeline. During off-cycle years, CPAs rise significantly (Meta 142%, Google 225%, YouTube 881%). Total ROAS drops to 60%. Hold list growth steady and focus on nurturing, segmentation, and testing.
Lead Gen ROAS by Year (% of Baseline)
| Year Type | Meta ROAS | Google ROAS | X ROAS | YouTube ROAS | Total ROAS |
|---|---|---|---|---|---|
| Election Year | 200% | 210% | 94% | 106% | 140% |
| Off-Cycle | 50% | 53% | 88% | 0% | 60% |
Lead Gen CPA by Year (% of Baseline)
| Year Type | Meta CPA | Google CPA | X CPA | YouTube CPA | Total CPA |
|---|---|---|---|---|---|
| Election Year | 75% | 770% | 106% | 96% | 106% |
| Off-Cycle | 142% | 225% | 96% | 881% | 125% |
Summary: When to Build, When to Push
Key Takeaway: During election years, scale donor acquisition, grow your lead list, and move leads into the pipeline quickly. During off-cycle years, hold volume steady, focus on nurture and segmentation, and use the time to test messaging and creative.
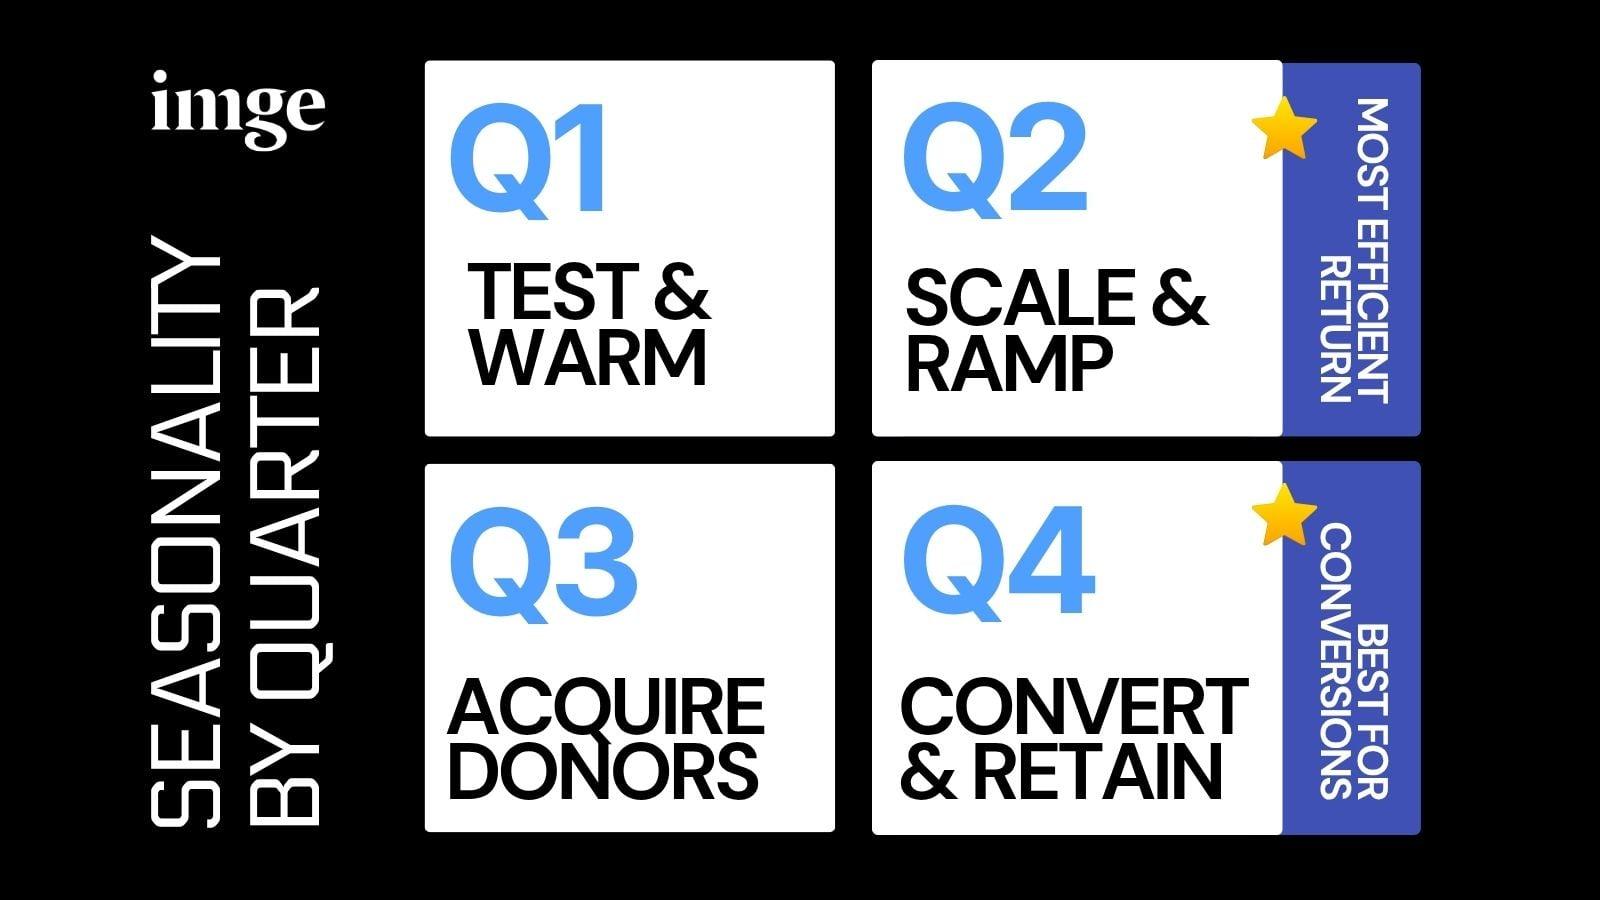
Quarter-by-Quarter Quick Reference
- Q1: Test messaging and creative. Weakest donor performance — don't over-invest in acquisition.
- Q2: Scale donor and conversion campaigns. This is your highest-ROI window.
- Q3: Grow lists and warm leads. CPDs improve but ROAS softens.
- Q4: Maximize donor revenue at urgency peak. Lead gen is also at its most efficient.
Seasonality Across the Cycle
| Cycle Phase | Direct Donate (Donors) | Lead Gen (Prospects) |
|---|---|---|
| Election Years | CPAs improve and donor value increases. Best time to scale donor acquisition and fundraising. | CPLs are more efficient and ROAS is stronger. Best window to grow your lead list and immediately move leads into the giving pipeline. |
| Off-Cycle Years | CPAs rise and ROAS softens as urgency drops. Best used for testing, retention, and re-engagement — not high-volume acquisition. | CPLs increase and lead value decreases. Focus on nurturing, segmentation, and message refinement, not aggressive volume growth. |
Strategic planning is cyclical. Use election years and Q2–Q4 urgency windows to maximize volume. Use off-cycle periods and Q1 to test, learn, and prepare.
We ran the numbers. Now let's put them to work for your campaign. Contact IMGE to learn how we can partner with you to maximize your 2026 ad spend.